
HTG EdgeSeq Reveal as a Statistical Analysis Tool for GEP
By Joe Alvin, PhD
Interpreting any flavor of “omics” data can be an overwhelming task, and transcript-omics with RNA-seq is no different. Quantifying human transcripts with the HTG Transcriptome Panel (HTP), yields ~20,000 data points per sample. This technology provides big data granularity: just two 96-well plates provide nearly two million unique transcriptomic profiles. Using a sequencing service, you’re often just provided with a handful of files to be transferred or converted to compatible formats. Walkthroughs, webinars, and demos get you started in analysis, but can’t help you troubleshoot if your results aren’t ‘typical’. HTG offers much more than simple data turn around— it offers a complete data pipeline through HTG EdgeSeq Reveal statistical analysis platform.
HTG EdgeSeq Reveal is a statistical analysis package designed to evaluate and analyze parsed data files(gene transcript counts) generated from assays performed using the HTG EdgeSeq system. HTG EdgeSeq Reveal is hosted on a dedicated and secured server, located within HTG's primary datacenter. Each application runs in its own protected environment and access is always SSL encrypted. HTG EdgeSeq Reveal comes with a complete user authentication protocol, preventing anonymous visitors from being able to access your systems and applications.
As described in Haslbauer et al. publication from University of Basel in Basel Switzerland, Reveal users can seamlessly annotate, triage, determine correlations, calculate differential expression and do so much more with their data. Other similar “all-in-one” tools are available but typically they are not supported long-term, have complicated user interfaces, are rarely updated, and lack a human team dedicated to user troubleshooting. Moreover, to use some of the basic capabilities of these tools the user must purchase a license or a subscription. Reveal is a webtool built on R, the statistical programming language. A key aspect of RNA-seq processing is how researchers address peak calling, genome alignment, repetitive sequences, and other aspects of quality control for sequencing data. Currently, the Reveal license does not require a subscription.
When using these stand-alone programs, it’s easy to make errors in command-line prompts, or run into the trap of applying different QC standards to each dataset. However, HTG developed internal QC metrics and validated their ability to screen out poor-quality data. These are applied to all samples assayed—ensuring robust run-to-run precision. Reveal automatically normalizes, QCs, and exports data in multiple formats, including raw delimited files (allowing for independent validation of conclusions). Working in a controlled environment, installing new software or changing environment variables just to look at your data is a nonstarter. With Reveal however, all a user needs is their data and a web browser.
Just select your samples or replicates for comparison, and Reveal will provide Spearman/Pearson correlations to quickly determine the precision of the experiment. While most statistical software can accomplish the same, none natively support differential expression calculations or other common RNA-seq analyses. Despite calculating the changes and significance, statistics software also lack common tools to help the researcher interpret the findings. In contrast, Reveal offers the three most used algorithms (DEseq2, edgeR, and limma) and will pipe differential expression results directly into bar charts, heatmaps, and volcano plots for analysis. Later on, we’ll provide straightforward guides on how to interpret some of these transcriptomic common plots.
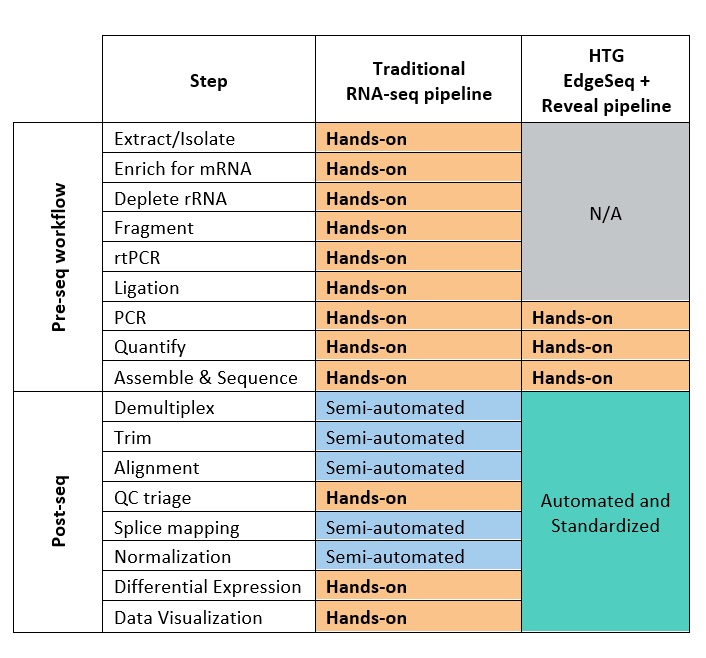
Below is a side-by-side comparison of traditional RNA-seq versus HTG EdgeSeq and Reveal pipeline. The table demonstrates the simplicity and the automation of each of the methods.
Takeaway
The HTG EdgeSeq Reveal software is a powerful, simple-to-use integrated solution for interrogating biostatistics and visualizing gene expression data using the HTG platform. It allows users to gain insights into complex biology quickly and discover gene signatures that enable a greater understanding of disease heterogeneity and the tumor microenvironment.