
HTG EdgeSeq Reveal
The HTG EdgeSeq Reveal software is a powerful, simple-to-use integrated solution for interrogating and visualizing gene expression data using the HTG platform. Gain insights into complex biology quickly and discover gene signatures that enable a greater understanding of disease heterogeneity and the tumor microenvironment.
Request Access
Powerful solutions
- Apply Quality Control metrics and keep or remove any sample for downstream analysis.
- Use the correlation tool to generate correlation plots to analyze control samples or replicates.
- Easily generate publication quality Principal Component Analysis plots, Volcano plots for Differential Expression analysis, Heat Maps and Expression Profiles
- Apply signatures to characterize changes in the tumor microenvironment, including the relative abundance of 23 immune and stroma cell types
Powerful Biostatistical and Gene Expression Profiling Tools for Your Data
HTG EdgeSeq Reveal enables the study and evaluation of gene expression data:
|
|
Quality control: Evaluate your data with recommended sample quality metrics that flag samples for insufficient quality, insufficient sequencing read depth and high background |
|
|
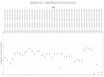
Correlation Plots: Generate Pearson and Spearman correlation plots to evaluate differences in samples, controls and replicates. |
|
|
Principal Component Analysis plots: Also known as PCA plots, is commonly used for dimensionality reduction by projecting each data point onto only the first few principal components to obtain lower-dimensional data while preserving much of the data’s variation. |
|
|
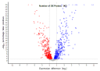
Differential Expression Analysis: Perform gene level differential expression analysis using volcano plots to discover quantitative changes in expression levels between experimental groups. |
|
|
Heat Maps: Heat maps of gene expression are provided for the simultaneous visualization of patterns of expression across samples and probes. The heat map provides transformed or normalized expression values mapped to color hue and intensity. |
|
|
Signatures: The HTG EdgeSeq Precision Immuno-Oncology and HTG EdgeSeq Pan B-cell lymphoma have available gene expression signatures. The HTG EdgeSeq Reveal Oncology family of signatures are designed to help elucidate information about the tumor microenvironment, including the relative abundance of 23 cell types. The HTG EdgeSeq Cell of Origin Signature is designed to help determine the Cell of Origin for lymphoma samples. |


HTG EdgeSeq Reveal Signatures
| Assay Name | Signature Name | Function |
| HTG EdgeSeq Precision Immuno-Oncology Panel | HTG EdgeSeq Reveal Oncology Immune, Stroma and TME Signatures | The Immune, Stroma and tumor microenvironment signature can be used to identify “hot” and “cold” tumors and interrogate the TME. |
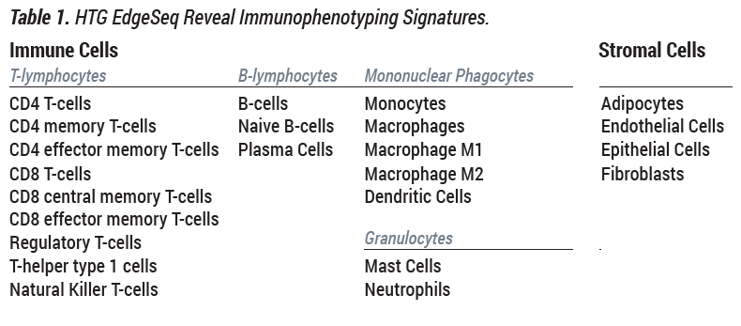
| HTG EdgeSeq Precision Immuno-Oncology Panel | HTG EdgeSeq Reveal Immunophenotyping Signatures | The Immunophenotyping Signatures can be used to determine the relative abundance of 19 immune and 4 stroma cell types (See Table 1) |
| HTG EdgeSeq Pan B-Cell Lymphoma Panel | Cell of Origin | The diffuse large B-cell lymphoma (DLBCL) Cell of Origin Signature can be used to determine the Cell of Origin status for DLBCL samples. |
Analyze data from these HTG RUO Panels

Analyze data from these HTG EdgeSeq RUO Panels


HTG EdgeSeq Reveal Tutorial
Watch the HTG EdgeSeq Reveal tutorial for in depth look into HTG’s new data suite. Learn how the HTG EdgeSeq Reveal can assess cancer relevance, visualize gene signatures, and normalize and analyze gene expression. See how the software can support your translational research.
Demo and Access Information
For a complete list of compatible HTG EdgeSeq assays, a product demonstration, or to request access to the HTG EdgeSeq Reveal software application please contact your HTG representative.
For Research Use Only. Not for Use in Diagnostic Procedures.
Already have access? Click button below to log in.
Resources and Publications
HTG EdgeSeq Reveal Product Sheet
Download pdf 933KB
HTG EdgeSeq Reveal Immunophenotyping Signatures
Download pdf 589KB
HTG EdgeSeq Reveal Immune, Stroma, and TME Signatures
Download pdf 198KB
Publications
Vascular Damage, Thromboinflammation, Plasmablast Activation, T-Cell Dysregulation and Pathological Histiocytic Response in Pulmonary Draining Lymph Nodes of COVID-19
Download pdf 11.1MB
View External Link
Request a Demo
For further information on HTG EdgeSeq Reveal, please fill out the registration form below or call us at (877) 507-3259.
Page last updated September 14, 2022