
Understanding Heat Maps in Gene Expression Profiling
Heat maps are a powerful tool for visualizing gene expression data in the context of gene expression profiling (GEP) and biomarker discovery. They allow researchers to quickly and easily identify patterns of gene expression that are associated with specific conditions or treatments.
The name heat map used for biological data visualization comes from the graphs’ resemblance to spatial heat maps used in geographical visualization of depth, distance, or temperature.
What is a Heat Map?
A heat map is a graphical representation of data that uses color coding to indicate the magnitude of values. Heat maps are commonly used in transcriptomics to visualize gene expression data. By measuring the number of RNA molecules produced by genes in a particular sample, researchers can determine the level of gene expression.
How to Interpret Heat Maps for Gene Expression Profiling?
Heat maps are often used to compare gene expression levels between different samples, such as healthy and diseased tissues. In a typical gene expression heat map, each row represents a gene, and each column represents a sample. The intensity of the color at each intersection point indicates the level of expression for that gene in that sample.
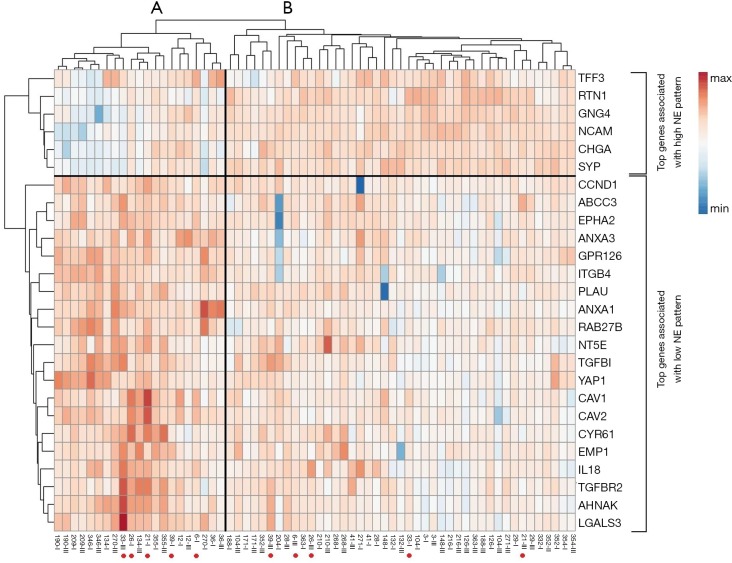
Example Heatmap Figure: Cluster and simultaneous heat map analysis identify NE(neuroendocrine) high (vs. NE low) subgroups based on top NE-associated genes. Each row represents an RNA gene and each column is a single sample. Cluster analysis clearly identified main cluster A and B that represents NE low and NE high subgroups, respectively.
When interpreting a heat map, the first thing to look for is patterns of gene expression that are correlated with particular samples or groups of samples. For example, if a heat map shows that a particular set of genes is highly expressed in a group of cancer samples but not in healthy samples, it may indicate the presence of a biomarker for cancer.
Another important feature to consider when interpreting a heat map is the range of expression levels represented by the colors. Typically, red is used to indicate high levels of expression, while blue (or green) indicates low levels. However, the specific range of expression levels associated with each color can vary as indicated in the above image with darker and lighter shades of red and blue. It's important to keep this in mind when interpreting the results, as the colors alone may not provide enough information to draw meaningful conclusions.
In addition to visual inspection of patterns and colors, heat maps can also be analyzed using statistical methods to identify the relationships of patterns and correlations in the data. One common technique is hierarchical clustering, which groups genes and samples together based on their similarity in expression patterns. In the example above, you can see that this dataset is clustered into groups A and B. Each row represents an RNA gene and each column is a single sample. This can help identify clusters of genes or samples that are biologically meaningful and may lead to the discovery of new biomarkers.
Examples of Biomarkers Discovered with Help from Heat Maps
Heat maps have been used extensively in biological research to identify potential biomarkers for diagnosis, prognosis, and treatment. Here are some examples of cancer biomarker research that relied on heat maps to identify biomarker associations:
- Ovarian Cancer: In a study published in the Journal of Translational Oncology, researchers used heat maps and HTG EdgeSeq technology to identify subsets of miRNAs that may be dysregulated in women at high risk (HR) of developing ovarian cancer compared to those at low-risk (LR). The study found that a vast majority of the differentially expressed miRNAs were downregulated in HR serum, with functional association analysis revealing that subsets of these miRNAs may target genes involved in hypoxia and androgen pathways that contribute to the HR state.
- Lung Cancer: In a study published in PLOS One, researchers used heat maps to identify a gene signature that predicted the survival of lung cancer patients. The signature included several genes involved in inflammation and immune response.
- Colorectal Cancer: In a study published in BMC Cancer, researchers used heat maps to identify a gene signature that predicted the response of colorectal cancer patients to chemotherapy. The signature included several genes involved in cell cycle regulation and apoptosis.
There are several software programs to help researchers generate these visualizations from data. The HTG EdgeSeq Reveal (Reveal) software is a powerful, simple-to-use integrated solution for interrogating and visualizing gene expression data using the HTG platform. Reveal allows for the easy generation of not only Heat Maps but also Principal Component Analysis plots, Volcano Plots, and Expression Profiles. To request a demo click HERE.
In summary, heat maps are a powerful tool for visualizing and analyzing gene expression data in biomarker discovery and other applications. By using data user-friendly data visualization software and carefully interpreting the colors and patterns in the heat map, researchers can gain insights into the activity of genes in different biological samples. Hence, they can identify potential biomarkers for various diseases and conditions.